For many years, the Insurance industry has been mining data to better understand how their new business should perform and to get an actionable view into their existing Book of Business. At Millennium Information Services, we also believe in the power of data by giving our clients insight into their inspection data through our comprehensive, detail-rich property survey reports, state-of-the-art data mining and analytical tools, and valuable inspection metrics that categorize and assess property risks that can all be used to make intelligent, insightful underwriting decisions.
It begins with intelligent data. All data tells a story and specifically, property data, can give a carrier a view into the quality of new business submissions, and also provide the underwriter better insight into the condition and hazards of a property to make intelligent decisions that best follow the underwriting guidelines of their company. Millennium captures hundreds of property and risk characteristics, including home construction features, policy rating variables, and conditions, hazards, and liability exposures. This detailed property data is fed into Millennium’s Automated Property System (“MAPS”), which serves not only as a data warehouse and workflow management tool, but offers a robust, flexible set of reporting capabilities which allow carriers to easily mine and analyze their inspection data. Identified issues are referred and assigned a weighted score (“Referral Value”) based on severity and the level of the underwriting concern. The sum of these weighted scores represents the Total Referral Value for each inspection – a discreet, policy-level indication of the cumulative severity of all noted conditions. Each inspection is also assigned a unique indicator, or Stack Logic® code, based on the prioritized outcome of the inspection (e.g., types of conditions observed, occupancy status, insurance-to-value opportunity, etc.). These qualifiers transform raw inspection information into Intelligent Data from which precise underwriting decisions can be made objectively.
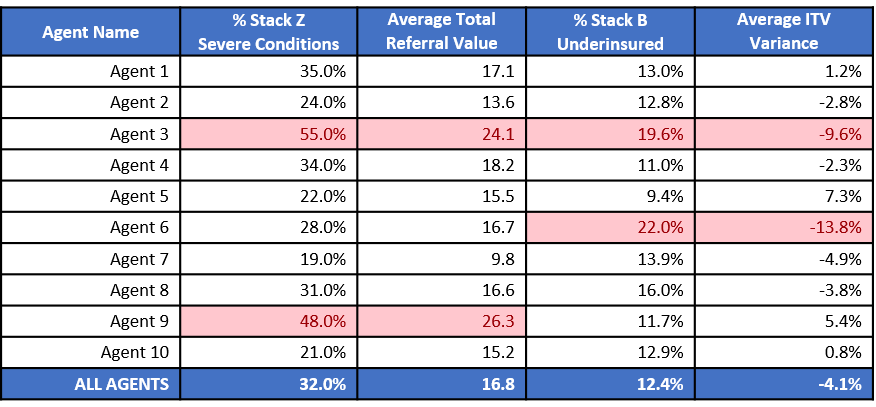
Evaluating agency performance is one opportunity that is provided through utilizing Intelligent Data. The chart below shows how, with the use of MAPS Ad Hoc reporting capabilities, a quick analysis of Stack Logic and Referral Values by Agent can be used to easily identify agents with a quality of business and/or excessive ITV deficiencies on policies submitted. Using pre-qualified, Intelligent Data allows policy quality analysis to be constructed quickly and for trends to be easily identified and monitored, long before profitability is impacted.
Identifying, understanding and being able to quickly respond to regional trends in conditions and hazards is also promoted through the evaluation of Intelligent Data. Roof damage is one of the most significant source of claim activity across the property and casualty insurance industry. That’s why, in addition to Stack Logic and Referral Values, we’ve developed our Roof Life Indicator. On each inspection report, along with comprehensive, detailed photo documentation, we provide assessment of the remaining roof life, broken into 4 categories, based on the observed condition of the roof at the time of inspection: 0 to 5 years, 6 to 10 years, 11-15 years, and 16+ years. Like Stack Logic and Referral Values, the Roof Life Indicator can be used not only to develop consistent action guidelines for individual risks – from roof repair/replacement to ACV roof endorsement to future re-inspection – but also to analyze the inspection book and easily identify those segments where roof age and condition issues are more prevalent. For example, take a look at the chart below showing the distribution of Roof Life Indicator by state:
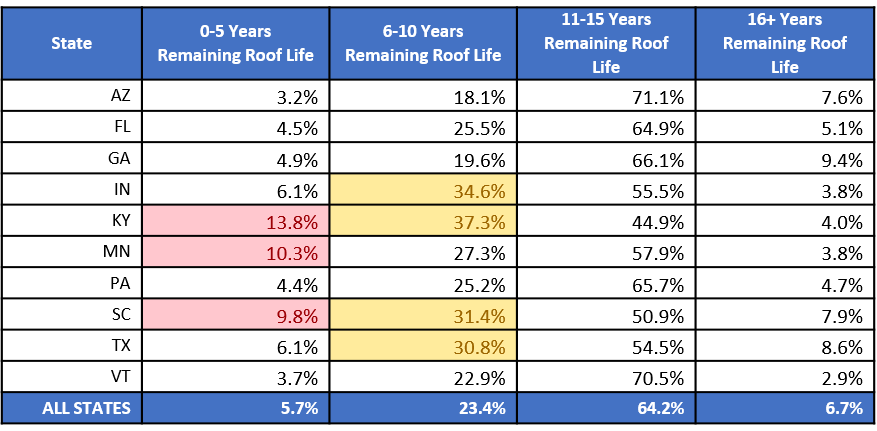
With MAPS’ dynamic reporting capabilities, carriers can easily drill down below the state level and view roof life indicator results at a county, city or zip code level to identify specific geographic areas where increased underwriting focus and action may be needed to mitigate future roof losses.
These are just a few examples of how Millennium is helping carriers to manage and improve the quality and profitability of their business through the use of data and data analytics. Intelligent Data, smarter decisions – that’s the Millennium advantage.